
Logging into Elasticsearch using Serilog and monitoring logs in Kibana (for .NET Core).
Structured logging....

Introduction
In a microservices architecture, monitoring logging may present significant challenges.
Logging into Elasticsearch using Serilog and viewing logs in Kibana is a crucial part of monitoring and analyzing your .NET Core applications. Elasticsearch, a distributed search and analytics engine, combined with Kibana, a powerful data visualization tool, allows you to collect, store, and visualize logs and other data from your application for better insight and troubleshooting. In this guide, we'll introduce the key components and steps involved in setting up this logging and monitoring system.
Prerequisite
.Net 7 SDK
Docker Engine (Linux distro)
Visual Studio
Before we dive in, let's take a moment to understand ElasticSearch, Kibana, and Serilog.
What is ElasticSearch
Elasticsearch is an open-source, distributed search and analytics engine designed for handling large volumes of data and performing near-real-time searches and analysis on that data.
Benefits of ElasticSearch
1- Real-Time Data Analysis
2- Scalability
3- Multi-Tenancy
4- Open Source
5- RESTful API
6- Built-In Data Replication and Fault Tolerance
What is Kibana
Kibana is an open-source data visualization and exploration tool that is often used in conjunction with Elasticsearch, as part of the Elastic Stack (formerly known as the ELK)
What is Serilog
Serilog is a popular open-source logging library for .NET and .NET Core applications. It provides a flexible and extensible way to log events and information within your software applications. Serilog is known for its structured logging capabilities, which means it allows you to log data in a structured format, making it easier to search, filter, and analyze log information.
Benefits of Serilog
1- Structured Logging
2- Flexible Sink Configuration
3- Asynchronous Logging
4- Log File Rotation (Rotate file as per configured TimeStamp)
Serilog provides different Sinks like in many databases, clouds, Files… etc.
Let’s move on coding part…
Before starting the Serilog code in VisualStudio We need to spin up the container of Kibana and ElasticSearch
1- Create a docker-compose.yml file (If you want you can place it inside the .Net core Solution )
version: '3.4'

services:

  elasticsearch:
    container_name: elasticsearchforlogging
    image: docker.elastic.co/elasticsearch/elasticsearch:8.7.1
    ports:
     - 9200:9200
    volumes:
     - elasticsearch-data:/usr/share/elasticsearch/data
    environment:
     - xpack.security.enabled=false
     - discovery.type=single-node
    networks:
     - elastic

  kibana:
    container_name: kibana
    image: docker.elastic.co/kibana/kibana:8.7.1
    ports:
     - 5601:5601
    depends_on:
     - elasticsearch
    environment:
     - ELASTICSEARCH_URL=http://localhost:9200
    networks:
     - elastic
networks:
  elastic:
   driver: bridge

volumes:
  elasticsearch-data:
Note: Both Kibana and ElasticSearch bind with the same network
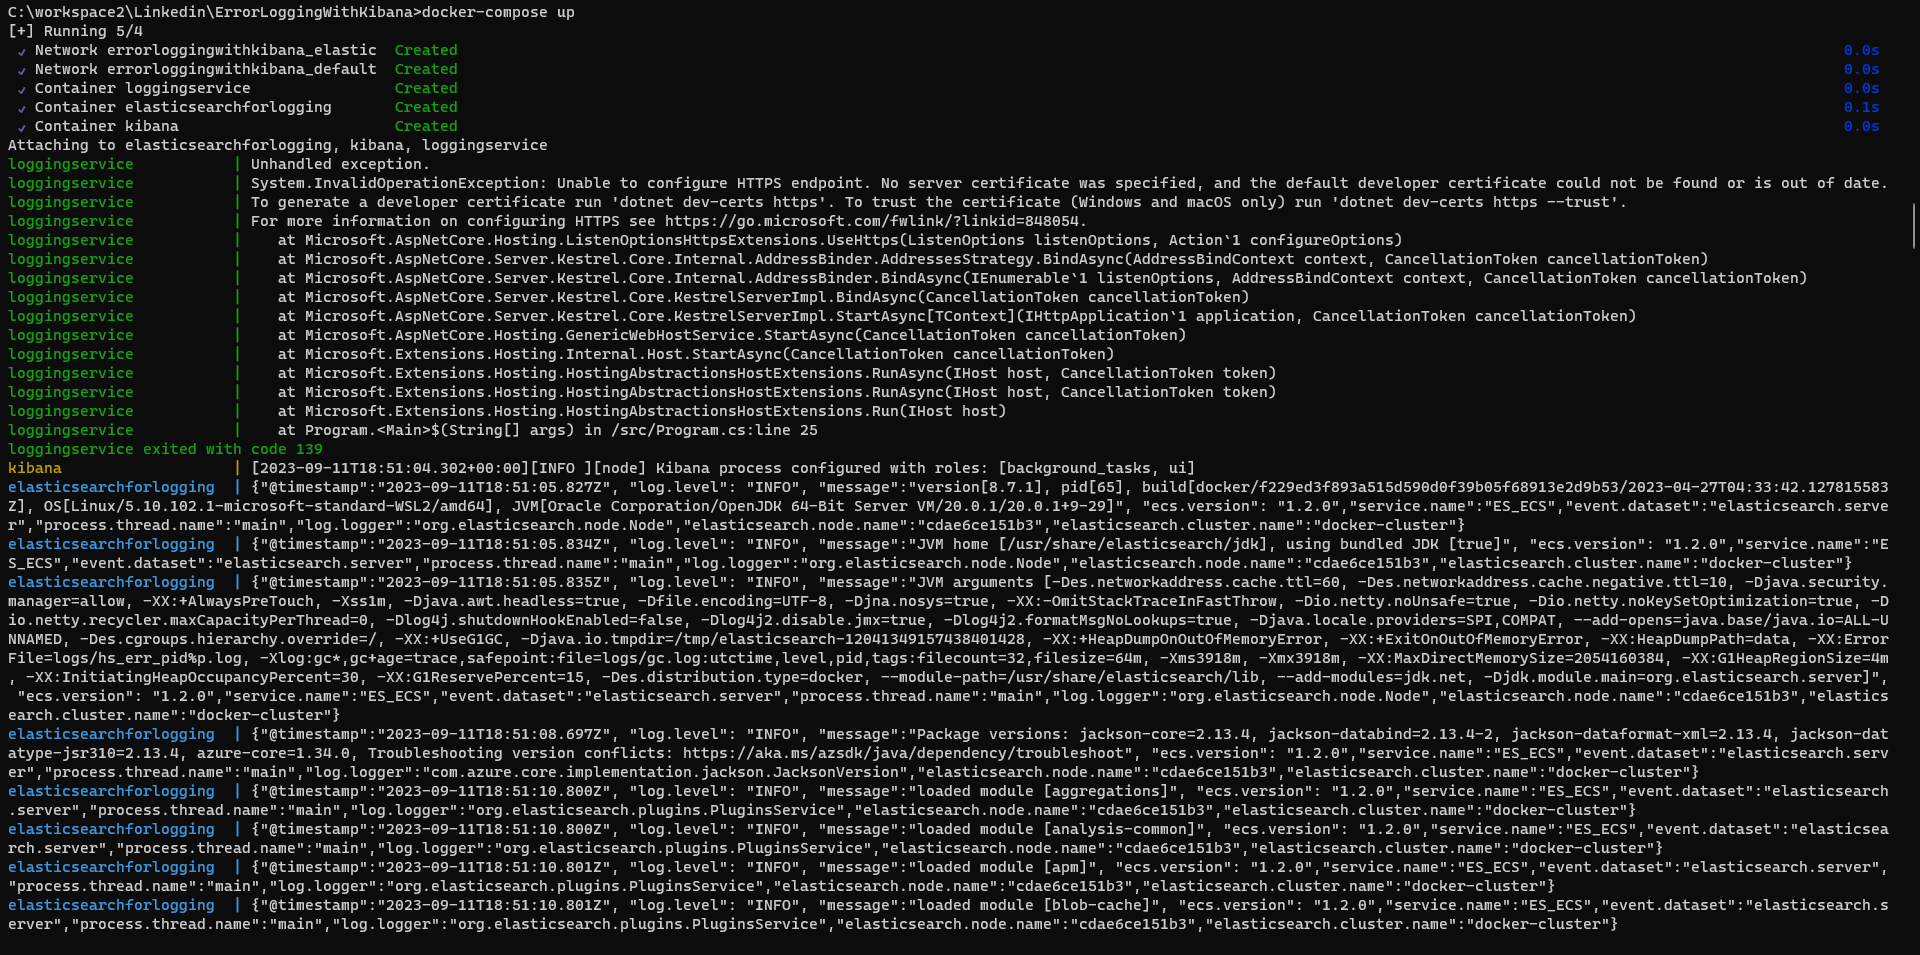
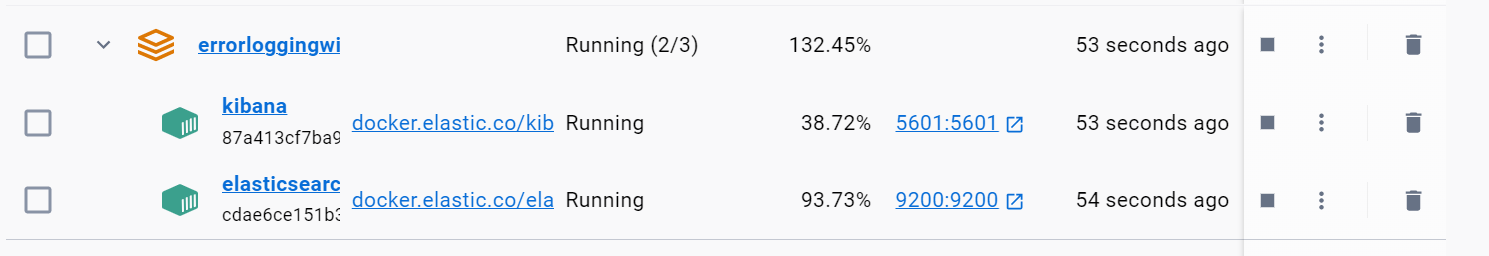
2- Run the Docker compose command to run the both container
docker-compose up -dAfter running the command, please wait for a few minutes for both containers to up and running. This is because it may take some time to download the image into the local registry.
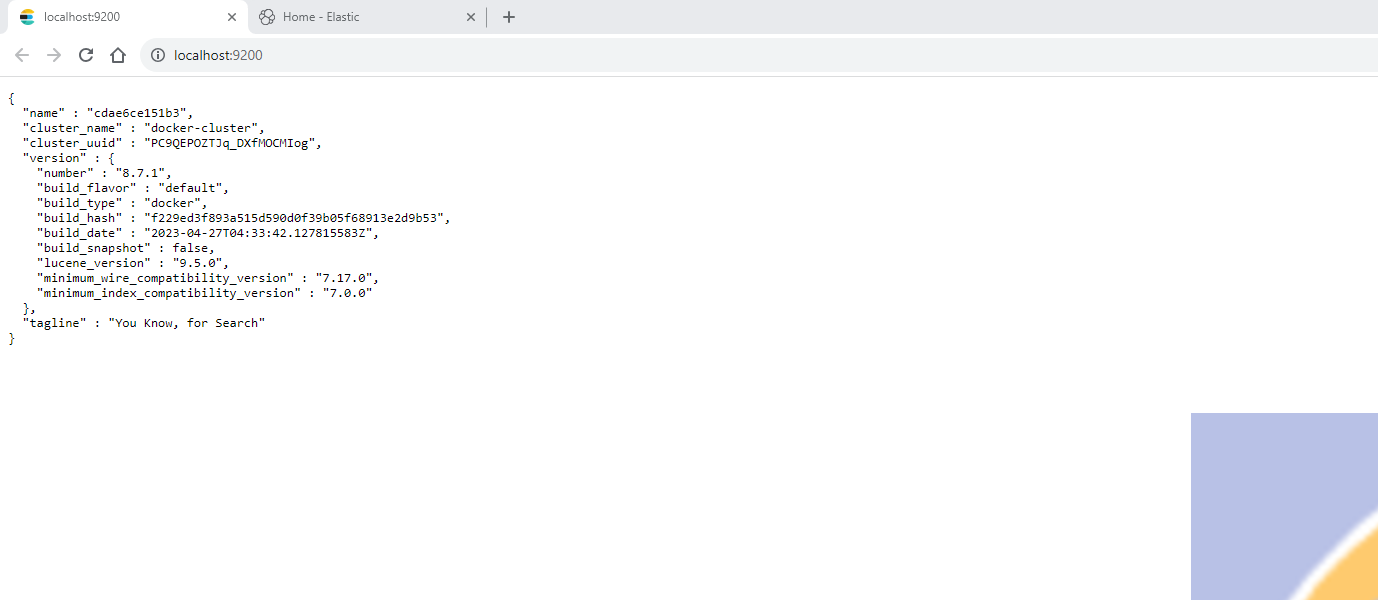
Navigate to http://localhost:9200
it shows the cluster name what is the current version..etc
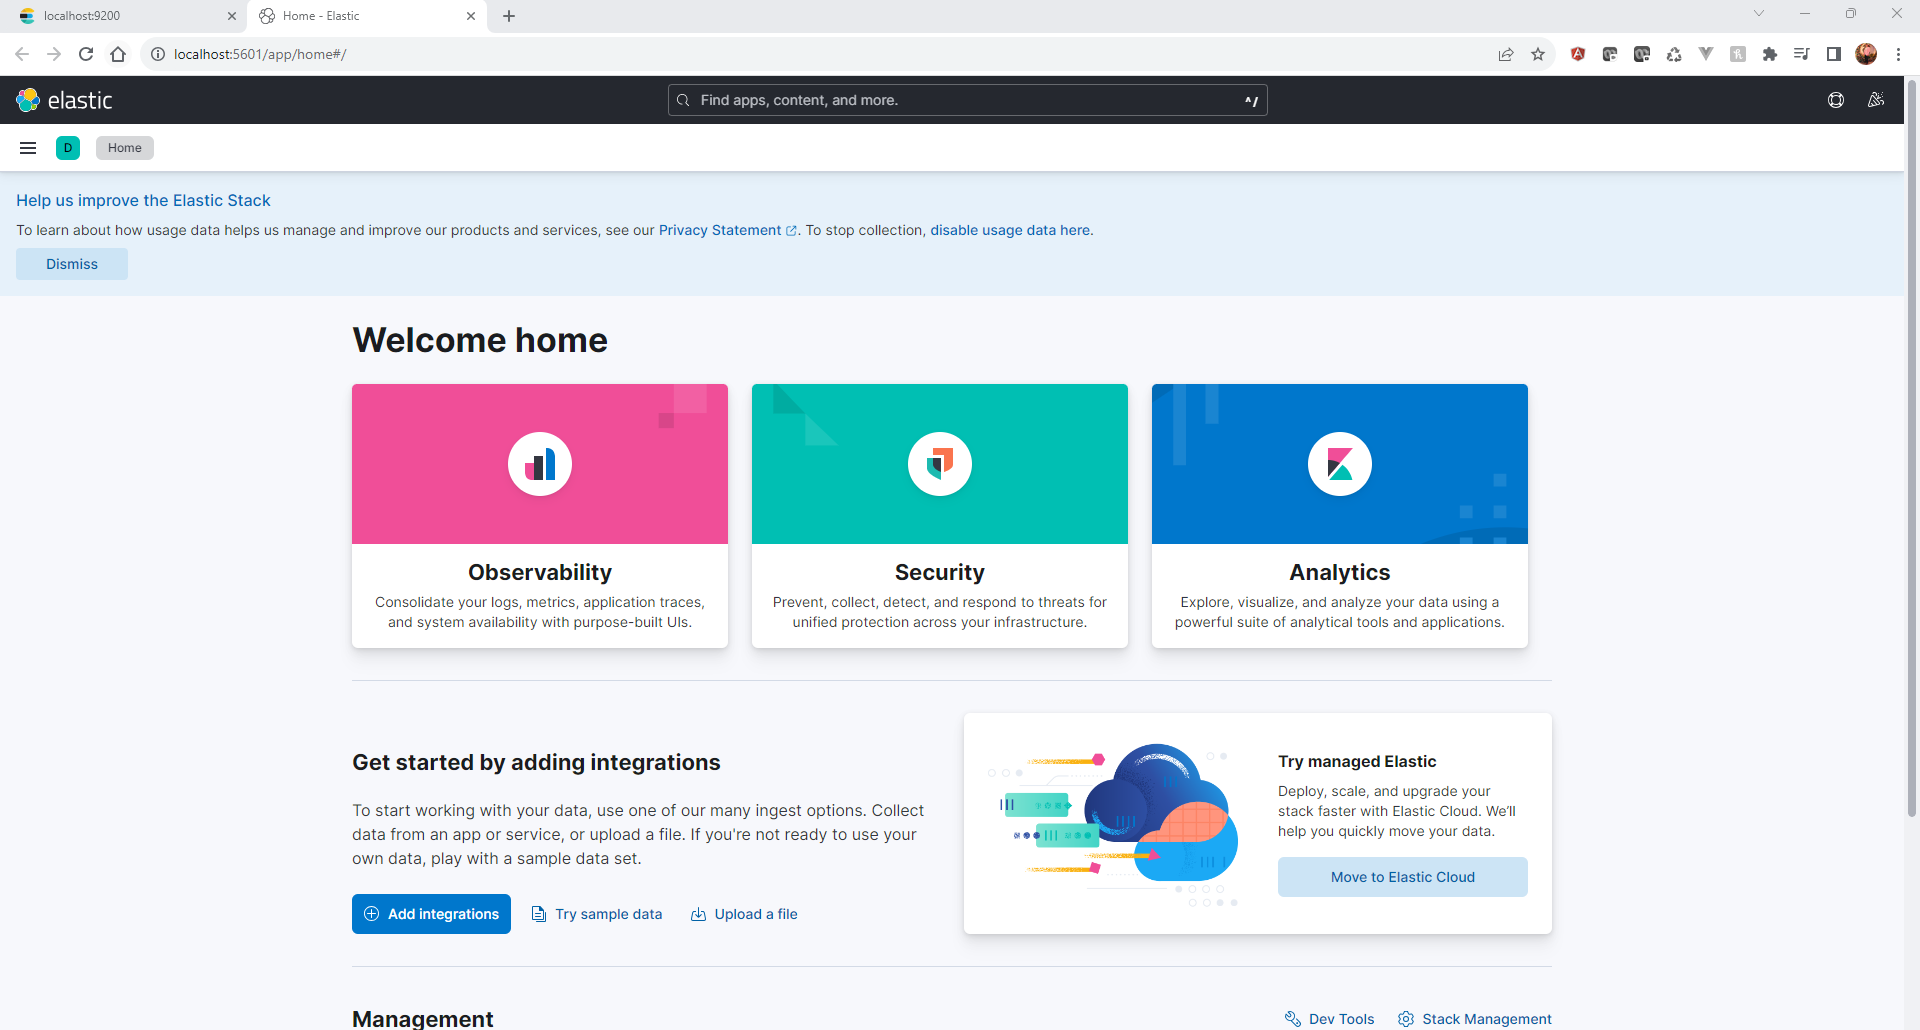
Verify the Kibana on http://localhost:5601
3- Create a .Net core project
dotnet new webapi -n ErrorLoggingWithKibanaAdding Nuget Packages to the Project
1- Serilog.AspNetCore
2- Serilog.Enrichers.Environment
3- Serilog.Sinks.Console
4- Serilog.Sinks.Debug
5- Serilog.Sinks.ElasticSearch
Use the below command to add the packages
dotnet add package Serilog.AspNetCoreWe should now update the appsettings.json file to configure Serilog and specify the desired log level to be sent to your ELK Server. Currently, the log level is set to 'Information,' which means it will log 'Warning,' 'Error,' and 'Fatal' messages but not 'Debug' and 'Verbose' messages.
{

  "Serilog": {
    "MinimumLevel": {
      "Default": "Information",
      "Override": {
        "Microsoft": "Information",
        "System": "Warning"
      }
    }
  },
  "ElasticConfiguration": {
    "Uri": "http://localhost:9200"
  },
  "AllowedHosts": "*"
}
Create Configuration Serlilog Configuration helper class
 public static class SerlilogHelper
    {

        public static void ConfigureLogging()
        {
            var enviorment = Environment.GetEnvironmentVariable("ASPNETCORE_ENVIRONMENT");
            var configuration = new ConfigurationBuilder().AddJsonFile("appsettings.json", optional: false, reloadOnChange: true).
                AddJsonFile(
                $"appsettings.{enviorment}.json", optional: true
                ).Build();
            Log.Logger = new LoggerConfiguration()
               .Enrich.FromLogContext()
               .WriteTo.Debug()
               .WriteTo.Console()
               .WriteTo.Elasticsearch(ConfigureElasticSearchSink(configuration, enviorment))
               .Enrich.WithProperty("Environment", enviorment)
               .ReadFrom.Configuration(configuration)
               .CreateLogger();
        }
        private static ElasticsearchSinkOptions ConfigureElasticSearchSink(IConfigurationRoot configuration, string enviornment)
        {
            return new ElasticsearchSinkOptions(new Uri(configuration["ElasticConfiguration:Uri"]))
            {
                AutoRegisterTemplate = true,//Automatically register
                IndexFormat = $"{Assembly.GetExecutingAssembly().GetName().Name.ToLower().Replace(".", "-")}-{enviornment.ToLower()}-{DateTime.UtcNow:yyyyy-MM}",
                NumberOfReplicas = 1,
                NumberOfShards = 2,

            };
        }
    }
Note: You should configure the timestamp format to be displayed correctly in Kibana. Additionally, specify the desired number of replicas for your setup.
Now you can add the Configure method inside the Program.cs file also adds the UseSerilog Method
SerlilogHelper.ConfigureLogging();
builder.Host.UseSerilog();
Now, Use the ILogger inside any controller or as per your code base
[ApiController]
[Route("[controller]")]
public class WeatherForecastController : ControllerBase
{
    private static readonly string[] Summaries = new[]
    {
        "Freezing", "Bracing", "Chilly", "Cool", "Mild", "Warm", "Balmy", "Hot", "Sweltering", "Scorching"
    };

    private readonly ILogger<WeatherForecastController> _logger;

    public WeatherForecastController(ILogger<WeatherForecastController> logger)
    {
        _logger = logger;
    }

    [HttpGet(Name = "GetWeatherForecast")]
    public IEnumerable<WeatherForecast> Get()
    {
        _logger.LogInformation("hello from WeatherForecastController");
        return Enumerable.Range(1, 5).Select(index => new WeatherForecast
        {
            Date = DateOnly.FromDateTime(DateTime.Now.AddDays(index)),
            TemperatureC = Random.Shared.Next(-20, 55),
            Summary = Summaries[Random.Shared.Next(Summaries.Length)]
        })
        .ToArray();
    }
}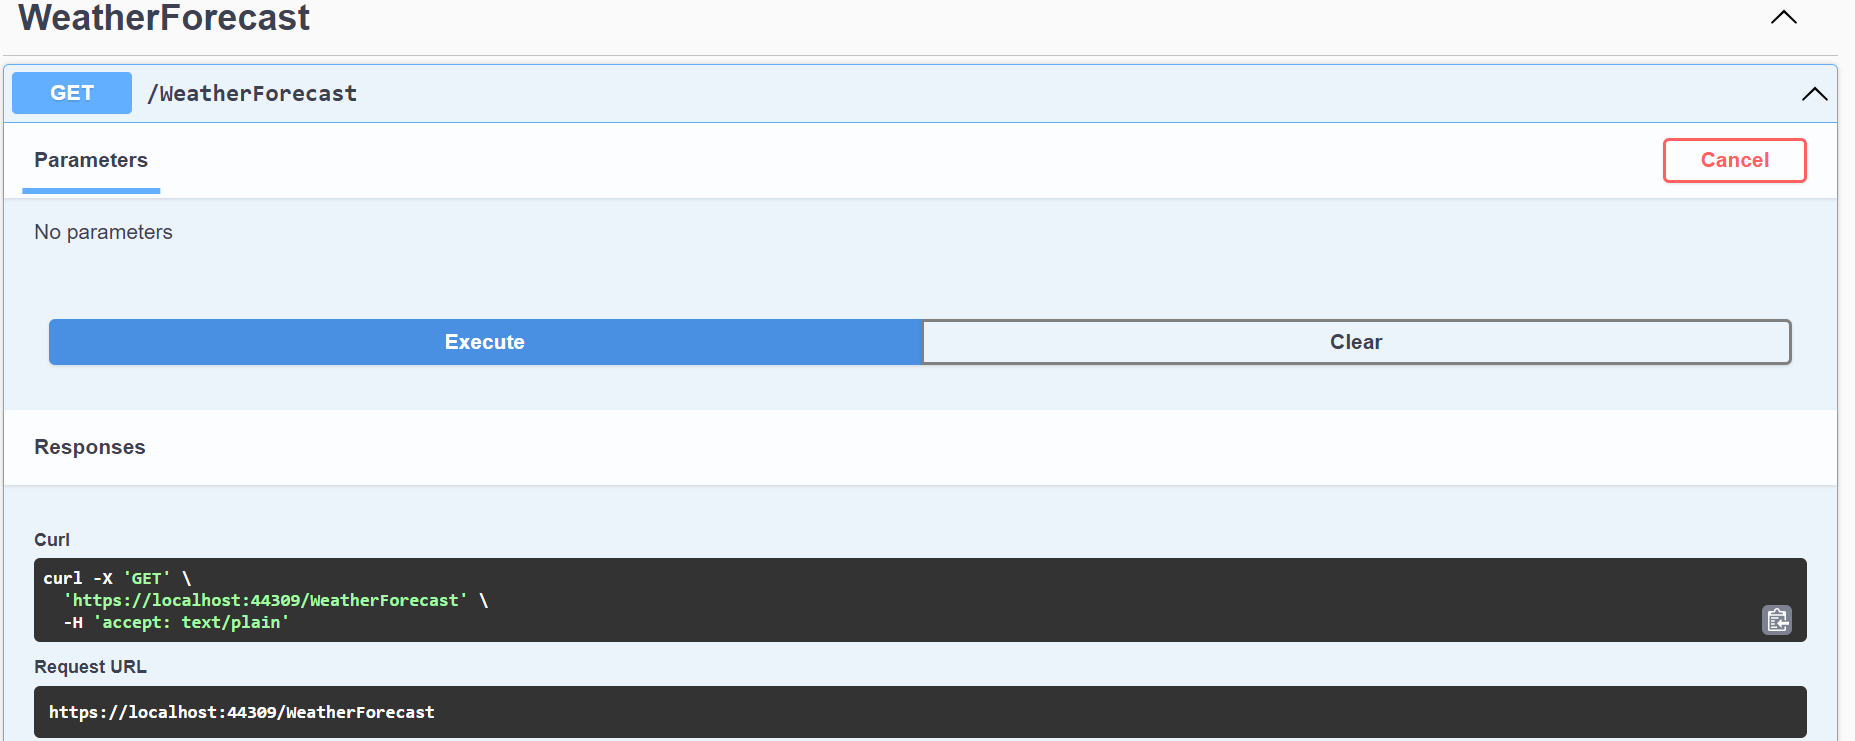
When you execute the endpoint, it will insert the logs into Kibana through Elasticsearch
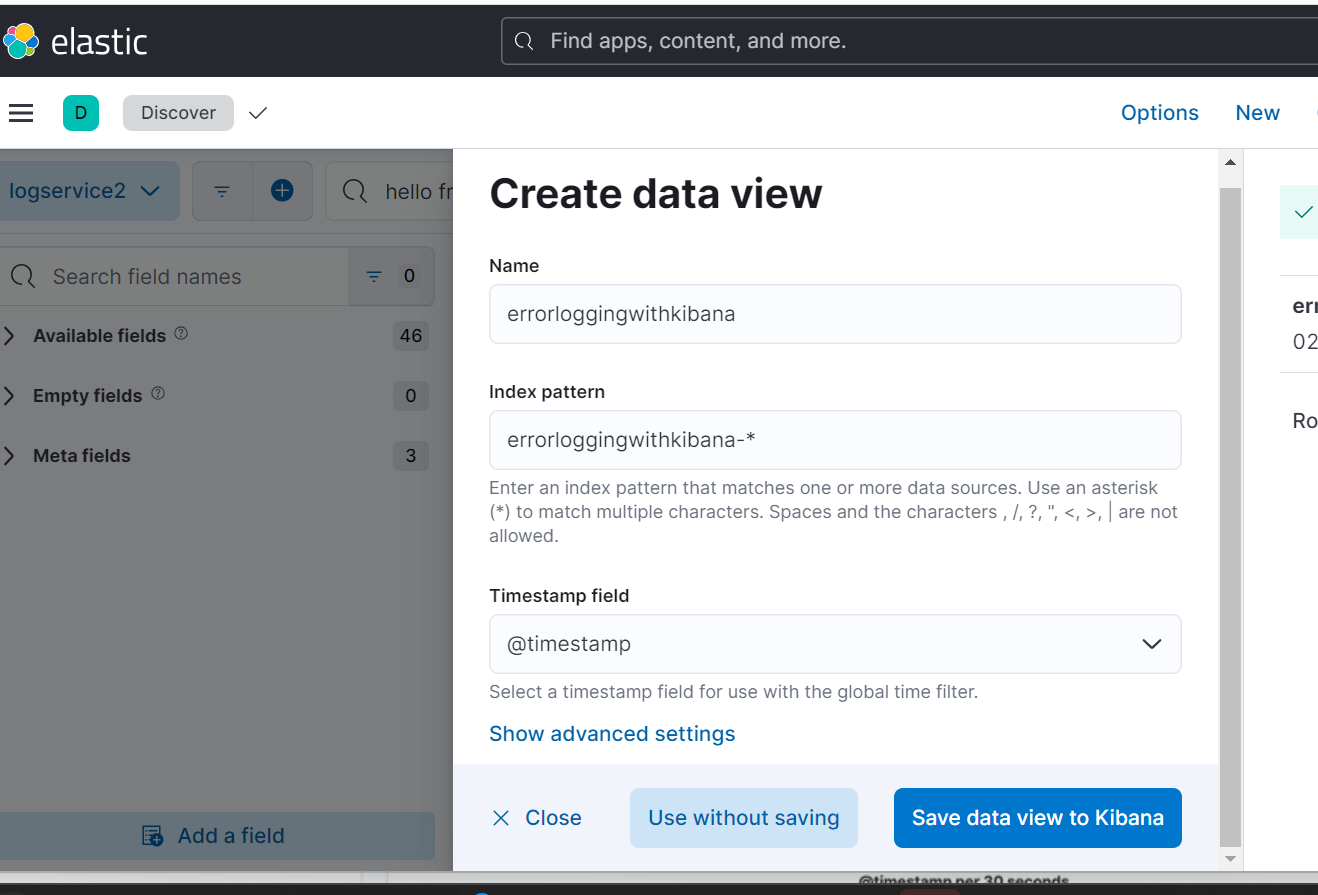
Open Kibana
Kibana is currently not displaying any logs. To access the logged data, you'll need to define an index first. You can achieve this by selecting the "Explore on my own" option on the default Kibana page and then navigating to the "Discover" link.
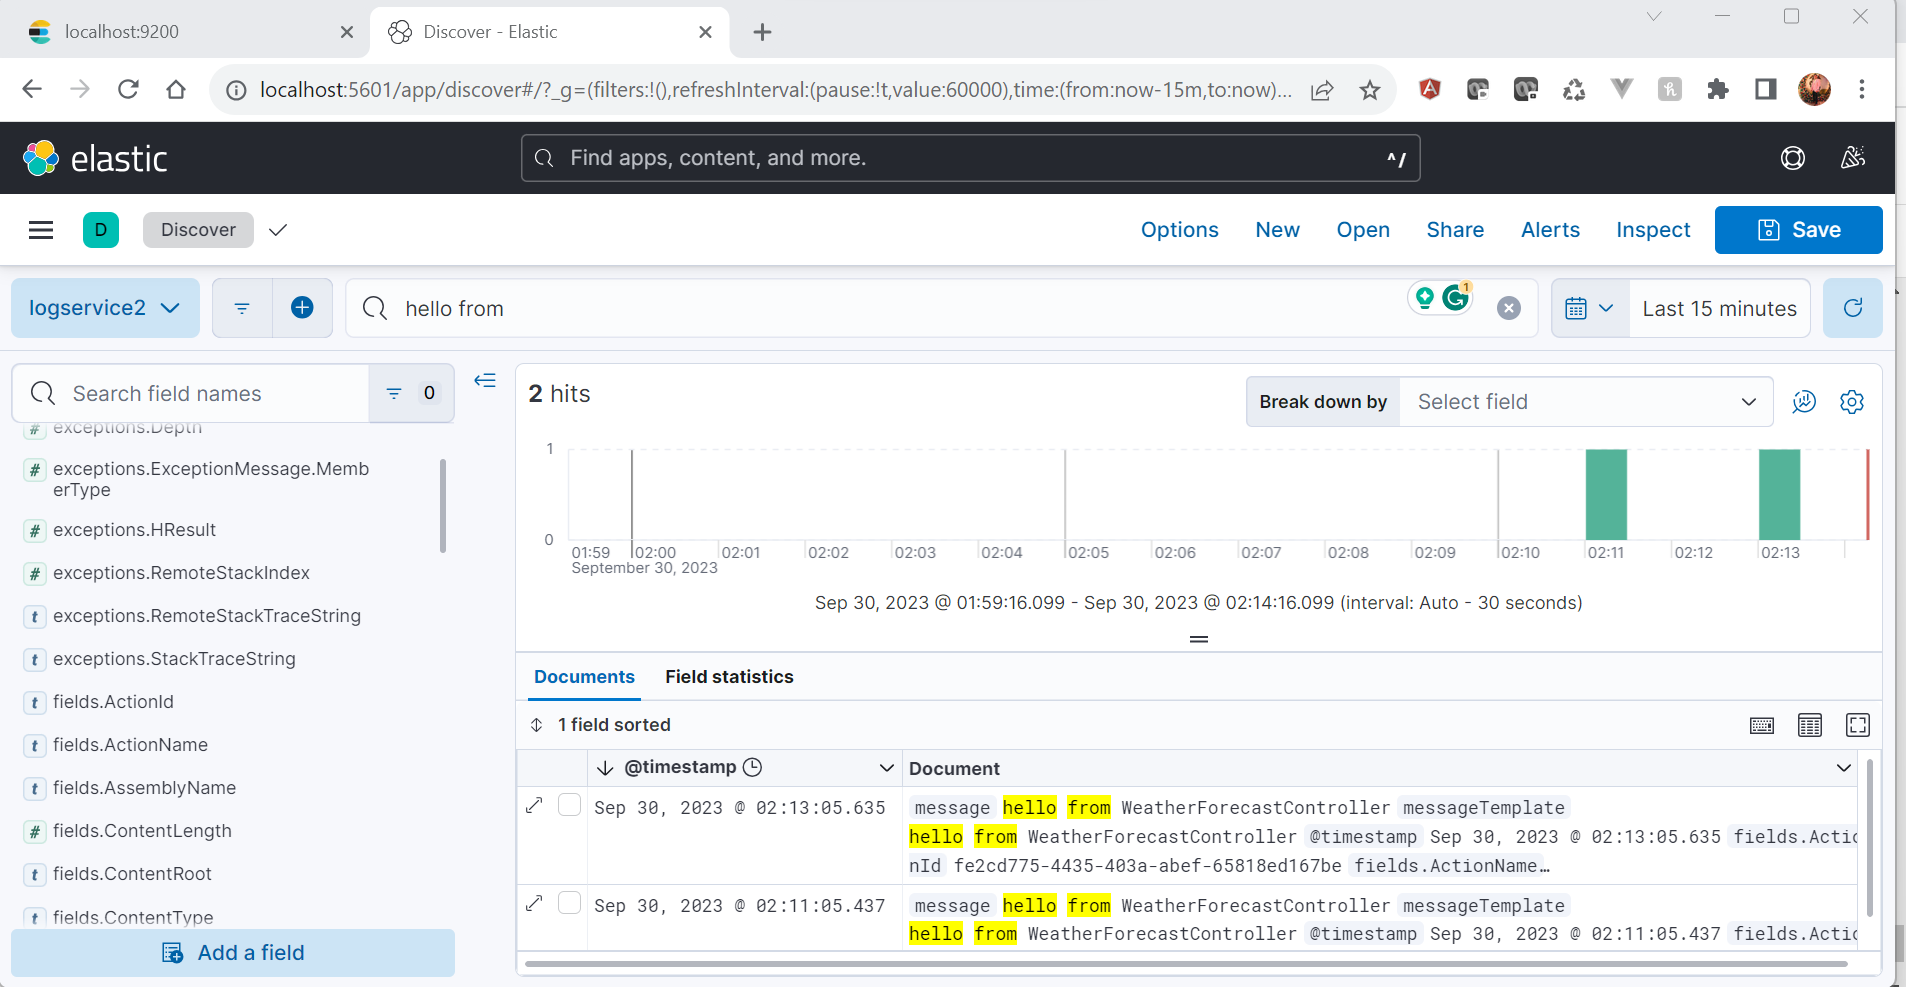
In the top header, please search for "messages." Here, you can observe that the date and time are displayed as configured in SerilogHelper, and you will also see the custom message that was logged from the controller. Next, I'm about to log another custom exception message from the controller.
[HttpGet(Name = "GetWeatherForecast")]
public IEnumerable<WeatherForecast> Get()
{
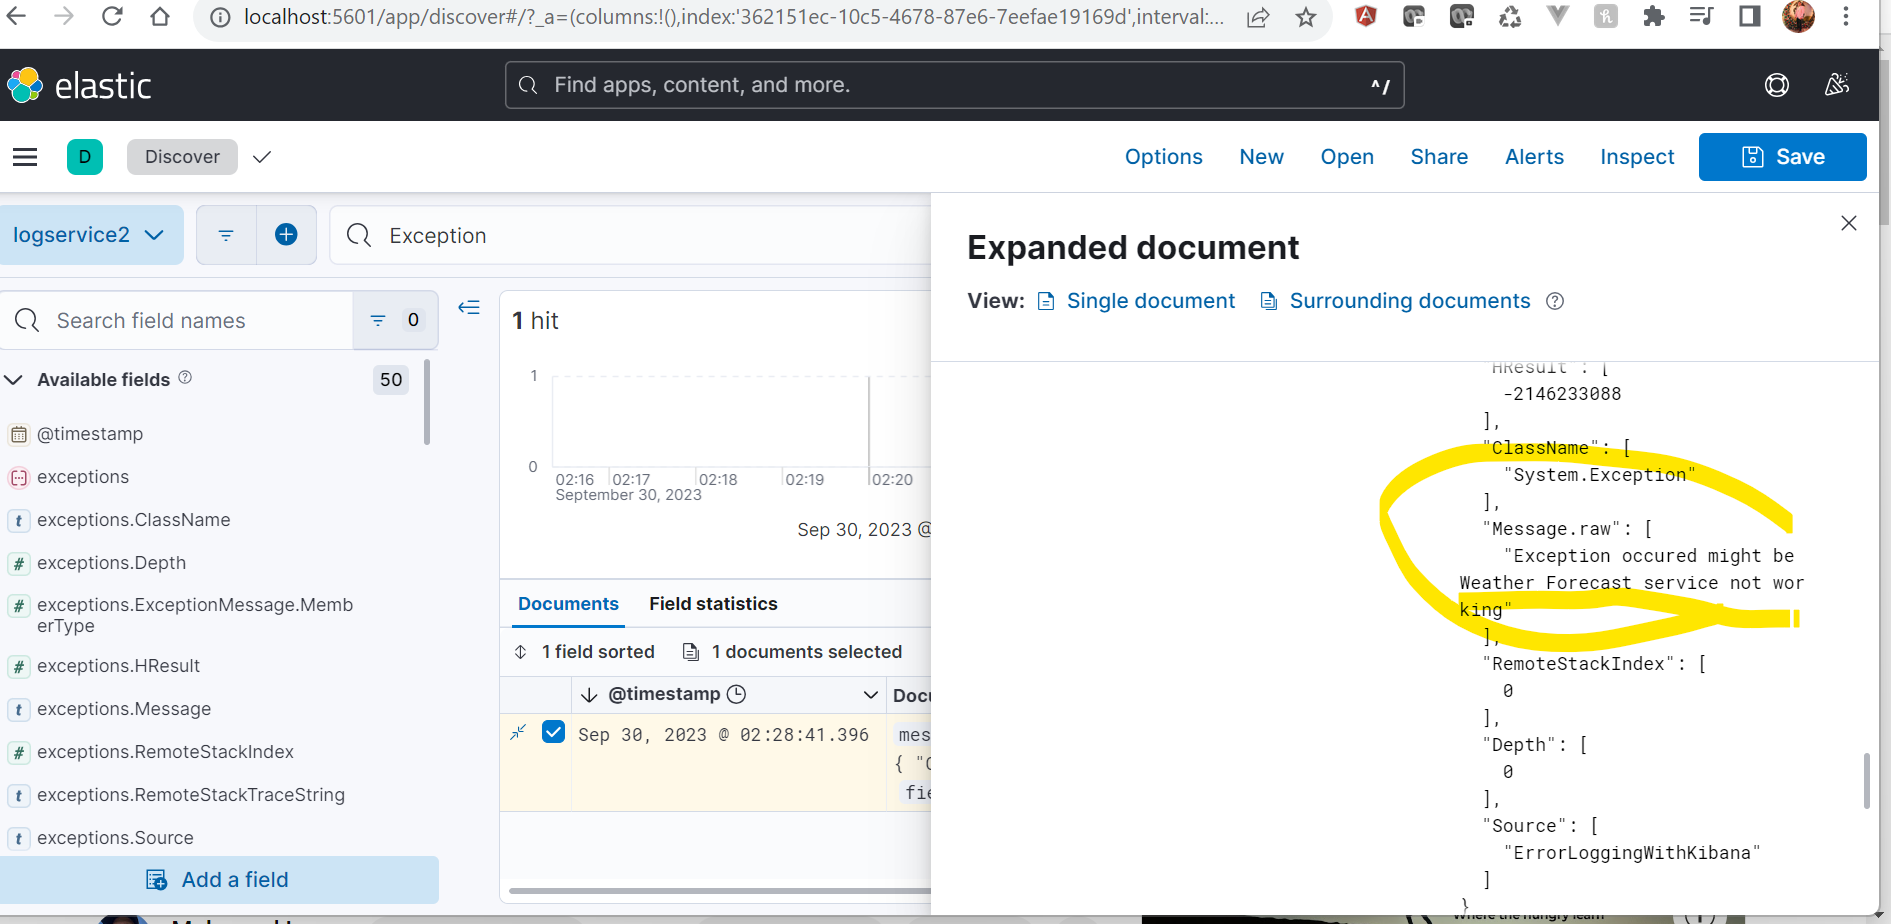
throw new Exception("Exception occured might be Weather Forecast service not working");
}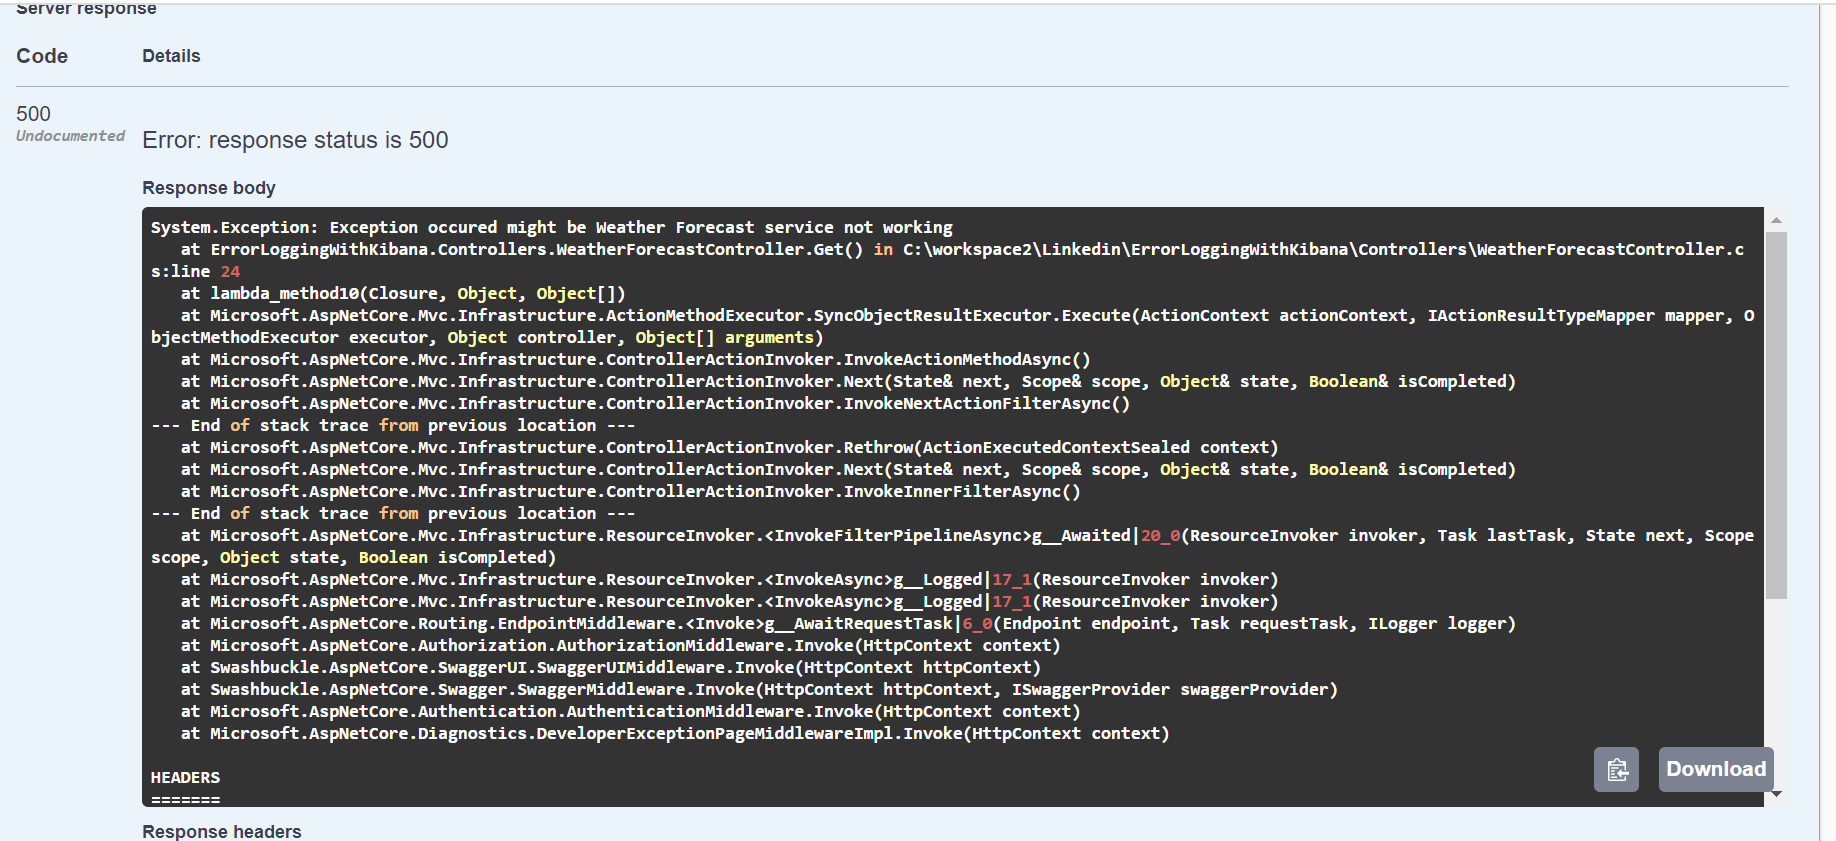
To verify this in Kibana, please click on the expand icon. The exception is quite lengthy, making it difficult to view the complete log here.
if you want to log more structured way you need to add
dotnet add package Serilog.Exceptions --version 8.4.0Now change in SerilogHelper class and add Enrich.WithExceptionDeatil()
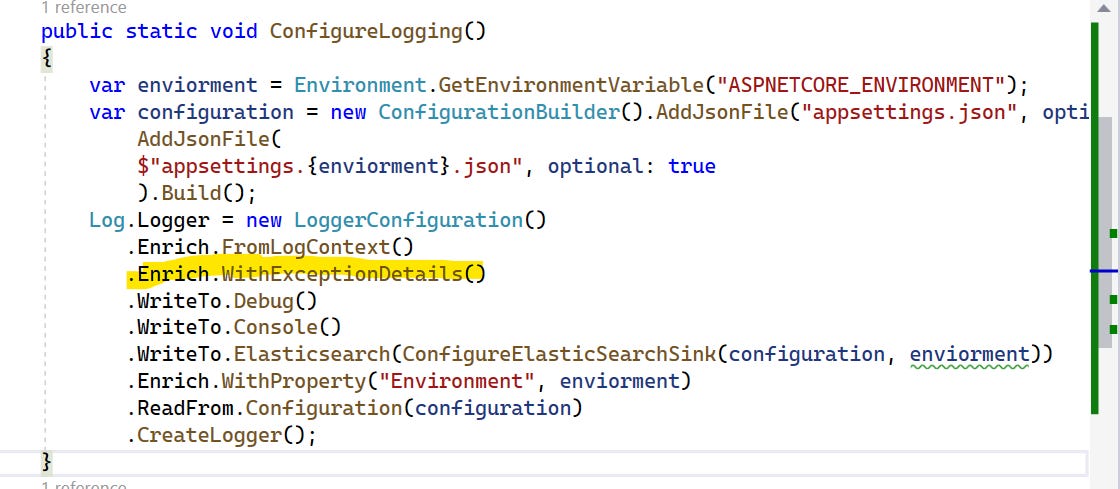
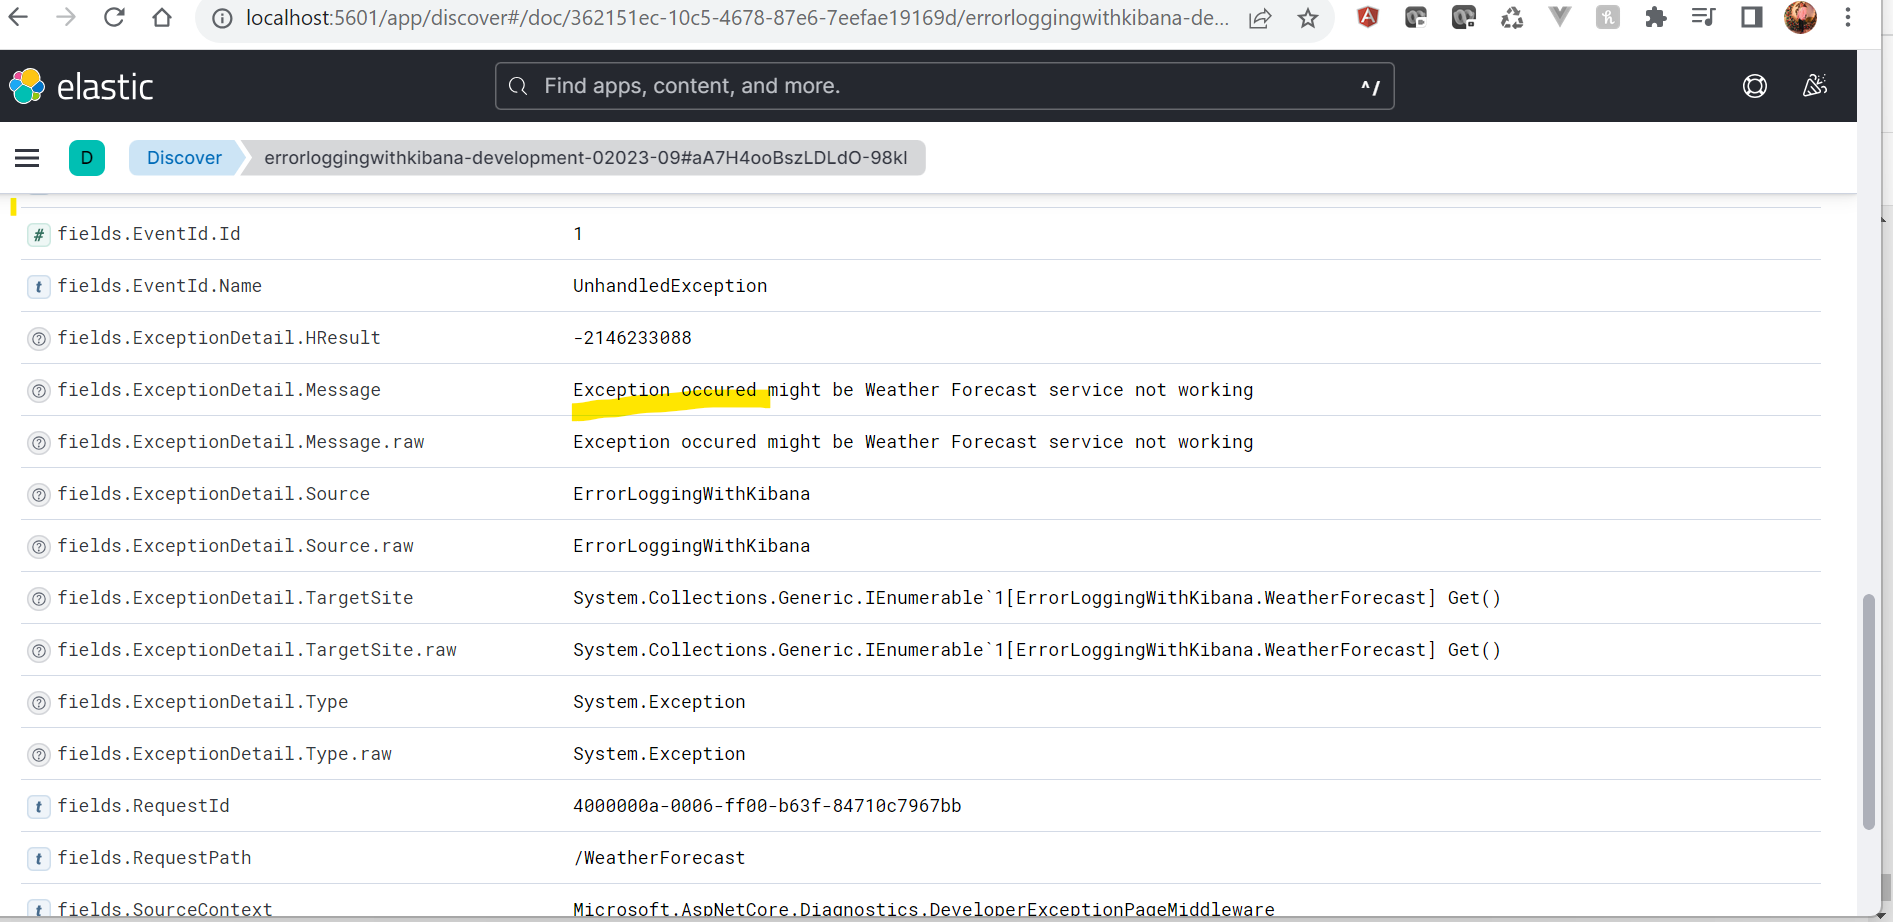
You should now log the new error, and in Kibana, you will observe more structured log details.
GitHub Repo: GitHub Repo ELK